ShopDreamUp AI ArtDreamUp
Deviation Actions


Description
A few months back, I was given grief by a person who is concerned about droughts increasing. This, upon my posting peer-reviewed research, which shows that:
Droughts were worse in the past.
Droughts were NOT increasing / have NO increasing trend.
She posted a portion of what looked like an article, about a person who said 'it is happening again.' comments.deviantart.com/1/4446…
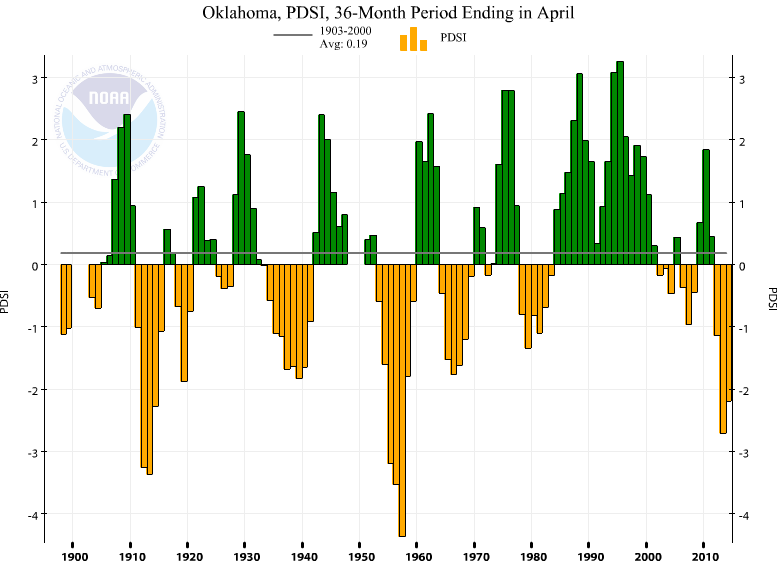
To that end, I provide this chart. It looks like:
Droughts happen a LOT in Oklahoma.
The most recent one is nowhere near as bad as several which happened LONG BEFORE CO2 PASSED THE OSTENSIBLY 'SAFE' LEVEL OF 350PPM (which it did in 1988, the year they really began screaming about weather we have always experienced).
And that's all I have time for this morning.
*edit* Almost forgot - you can chart your own info here www.ncdc.noaa.gov/cag/
Droughts were worse in the past.
Droughts were NOT increasing / have NO increasing trend.
She posted a portion of what looked like an article, about a person who said 'it is happening again.' comments.deviantart.com/1/4446…
To that end, I provide this chart. It looks like:
Droughts happen a LOT in Oklahoma.
The most recent one is nowhere near as bad as several which happened LONG BEFORE CO2 PASSED THE OSTENSIBLY 'SAFE' LEVEL OF 350PPM (which it did in 1988, the year they really began screaming about weather we have always experienced).
And that's all I have time for this morning.
*edit* Almost forgot - you can chart your own info here www.ncdc.noaa.gov/cag/
Image size
777x577px 24.92 KB
© 2014 - 2024 Kajm
Comments6
Join the community to add your comment. Already a deviant? Log In
I could be wrong, but the drought that caused the dust bowl was not CO2 related but it had to do with very poor farming practices. It has been ages since we studied it, but being from that area we had classes on it and it was something to do with bad in the topsoil, not rotating crops (only wheat), destroying the natural ground cover, etc. The same thing is partially responsible for the 1950's to a degree and the congress tried to address it. But the data I heard was that droughts are increasing, but for far shorter stints...so basically the weather is becoming for more erratic as that area always had long drought periods. The only fact I know for sure is the reason it is so windy in Oklahoma is that the only thing between it and the north pole is a pipeline...and it is down in some places.
P.S. Nice graph.
P.S. Nice graph.