The central, endlessly repeated lie upon which the wind industry seeks to ‘justify’ the colossal and endless subsidies upon which it critically depends; the destruction of wind farm neighbours’ health, wealth and happiness; and the slaughter of millions of birds and bats, is that wind power causes substantial reductions of CO2 emissions in the electricity sector.
STT has been slamming that myth since we cranked into gear nearly 3 years ago. It’s a topic that attracts plenty of interest.
Our post – How Much CO2 Gets Emitted to Build a Wind Turbine? – has clocked over 11,000 hits; and still attracts plenty of attention. But that story is limited to a back of the envelope calculation of the CO2 emissions that this so-called ‘fossil free’ power source clocks up before these things start spinning.
In this post we hand over to a pair of switched on energy experts, Alex Henney and Frank Udo, as they tackle the wind power CO2 abatement myth – in terms of its failure to reduce CO2 emissions to the degree claimed by the wind industry; or at all.
How Much CO2 Do Windmills Really Save?
Not a lot of people know that
Alex Henney
6 November 2015
WINDMILLS DO NOT MITIGATE CO2 AS CLAIMED ON THE TIN1
“When the facts change, I change my mind. What do you do sir?”
J.M. Keynes
INTRODUCTION
Peter Lang posted a blog “Wind turbines’ CO2 and abatement cost” on 27 April 2015 based on his submission to the Australian Select Committee on Wind Turbines dated 23 March 2015. He advanced similar analyses to those which provided to the then Minister for Energy of the British government in September 2011. We drew on empirical experience from Ireland and the US.
IRELAND
In 2011 gas produced 66% of Irish electricity; coal 11%; peat 8%; wind 12%; hydro and pumped hydro 2.5%; other 1%. Most of the balancing or load following to respond to variations in wind and output is provided by CCGTs and OCGT’s and 3 hydro facilities including a pumped storage plant.
Eirgrid, the system operator, calculates the emissions of CO2 from the system as a whole using “static” heat rates for thermal plants (i.e. assuming they operate at a constant output). This approach overstates their efficiency and understates their CO2 emissions because when gas plant ramp-up and –down (i.e. “cycle”) their thermal efficiency reduces – hence their CO2 emissions/MWh increase (i).
The estimated average emissions using static heat rates for the period November 2010 to August 2011 was 451g/kWh while the average CO2 emissions calculated from the carbon input from gas and coal was 528g/kWh, which is 17% higher. Part or all of this difference can be attributed to the static approach used in the CO2 calculation of Eirgrid.
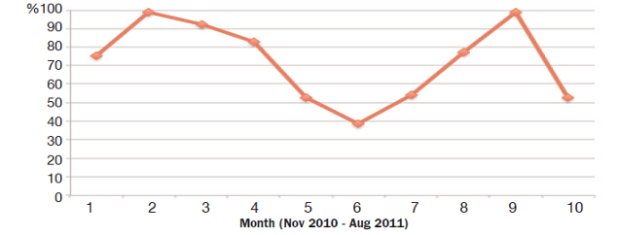
The CO2 savings for the period November 2010 to August 2011 were analysed and the “efficiency” of wind in reducing CO2 emissions defined as (ii):-
The ratio of the measured reduction in CO2emissions, to the reduction in CO2emissions calculated as if every MWh of wind energy produced replaces a MWh of conventional electricity production without change in efficiency of the conventional plants.
The efficiency varies month by month, see exhibit 1.
Exhibit 1 The efficiency of wind in reducing CO2 in Ireland
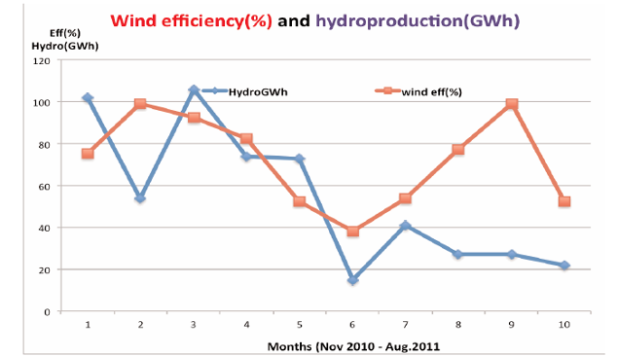
Why the difference from month to month? In particular what happened in April 2011? The answer might be the availability of hydro, see exhibit 2.
Exhibit 2 The influence of hydro power on CO2 saving efficiency
In 2011 the pumped storage facility at Turlough Hill was being renovated; in consequence gas plants had to cycle more and thus produced more CO2. The result was that a 12% wind contribution saved only 4% CO2 emissions4. A subsequent analysis found that when wind production averaged about 15% the thermal efficiency of the fleet of CCGTs was 40% compared with their nameplate efficiency of 55% (iii).
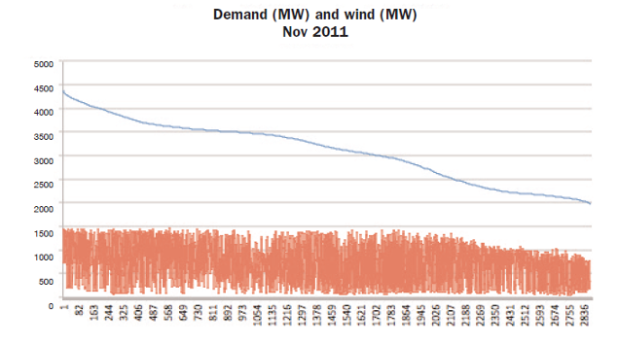
Another constraint on wind is the amount of must-run capacity, which is 1300MW. Thus when the demand is low and the wind is high, wind energy has to be spilled. This is demonstrated with the aid of a load duration curve constructed from all the daily load curves with the points sorted in order of decreasing demand. Exhibit 3 shows the load duration curve (iv) for November 2010 with the associated level of wind; once demand reduces below about 2500MW the wind is increasingly curtailed – in this case about 3% is lost.
Exhibit 3 Wind is uncorrelated with demand so when demand is low it would have to be spilled
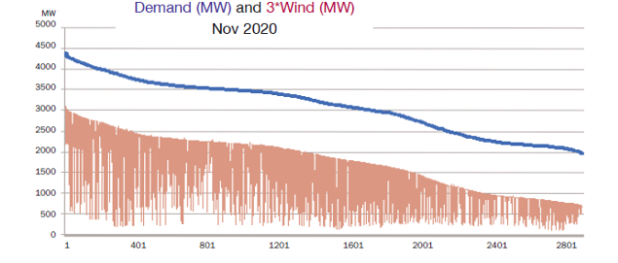
The Irish government has a target of three times the current level of wind by 2020, which would result in spilling 30% of the wind energy production, see exhibit 4.
Exhibit 4 If the government target for wind in 2020 were met, 30% of the wind energy would have to be spilled
COLORADO AND ERCOT
Energy Consultant Bentek (v) undertook a study of the effect of wind on emissions of SOx, NOx and CO2 for two systems:-
- The system of Colorado Public Service Company (PSCO), which in 2008 had 3.8GW of coal plant, 3.2GW of gas plant, 0.4GW of hydro and pump storage, and 1.1GW of wind, and
- The ERCOT system in Texas, which is a virtually stand-alone system that manages about 85% of the capacity in Texas. In 2009 it had 17.5GW of coal plant, with 44.4GW of gas plant, 5.1GW of nuclear, 0.6GW of hydro, and 9.4GW of wind; the system produced 300TWh and met a maximum demand of 63GW. Wind provides between 5% and 8% of the average generation overall, depending on the season, but at night its contribution rises slightly from 6% (summer) to 10% (spring)
Both systems are predominantly thermal with significant wind relative to their size, and little hydro.
The studies used publicly available hourly data for boiler specific emissions and production which are provided to the Continuous Emissions Monitoring System of the Environmental Protection Agency and data provided to the Federal Energy Regulatory Commission.
ERCOT also publishes wind, coal, nuclear, natural gas and hydro generation data on a 15-minute basis. The PSCO part of the report first examines in detail the impact of cycling for CO2 coal plants over a number of days when there are “wind events”.
The avoided generation from coal plants was calculated; the monthly and quarterly “stable day” emission rate was calculated; finally the difference between the actual emissions and the emissions that would have been generated if the avoided generation had been produced with the “stable day” emission rates was calculated.
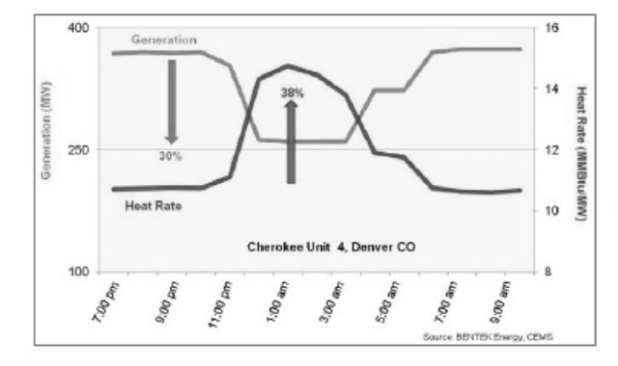
The effect of cycling coal plant is shown by the operation of Cherokee Unit 4 located in Denver. Between 7:00 pm and 9:00 am on March 17 and 18, 2008, see exhibit 5. “Total generation from the plant is shown in blue; the heat rate – defined as the MMBtu of fuel per unit of generation – is shown in red.
Between 9:00 pm and 1:00 am, generation from the Cherokee 4 fell from 370 to 260 MW. It then increased to 373 MW by 4:00 am. During the period in which generation fell by 30%, heat rate rose by 38%. Heat rates are directly linked to cycling: as the generation from coal plants falls, the heat rate begins to climb. Initially, the heat rate climbs because generation of the plant is choked back and fewer MW are produced by the same amount of coal.
Later in the cycle, the heat rate climbs further because more coal is burned in order to bring the combustion temperature back up to the designed, steady-state rate. Additionally, for many hours after cycling, the heat rate is slightly higher than it was at the same generation level before cycling the plant.”
Exhibit 5 Impact of generation decline on heat rate
In addition to the micro study of wind events on particular plants, the study also looked at the coal cycling impacts on PSCO’s territory emissions. The conclusion of the study was that:-
“…cycling of coal-fired facilities has increased significantly since 2007 as wind energy generation increased to its current levels … the increased incidence of cycling has led to emission of greater volumes of SO2, NOx and CO2. In 2008, depending on the method of calculation, cycling coal plants caused between 1.1 and 10.5 million pounds of SO2 to be produced that would not have been produced had the plants not been cycled…Cycling’s impact on CO2 is more ambiguous as the range is between creating a saving of 164,000 tons and a penalty of 151,000 tons. In 2009, generation from PSCO’s coal-fired plants fell off by about 20%, but their emissions did not diminish proportionately. Again, cycling appears to be a central factor … between 94,000 and 147,000 pounds of CO2 [was produced] more than would have been generated had the plants been run stably.”
The conclusion of the study of ERCOT, which was undertaken in a similar manner to their PSCO analysis, is:-
“Not only does wind generation not allow ERCOT utilities to save SO2, NOx and CO2 emissions, it is directly responsible for creating more SO2 and NOx emissions and CO2 emission savings are minimal at best.”
THE RESPONSE OF THE BRITISH GOVERNMENT TO THESE FINDINGS
Like the Irish system, the British system is predominantly thermal and balancing will largely depend on oldish frame CCGTs. The Irish system is the “canary in the mine”.
We recommended that before spending £ tens of billions more on windmills, the British government should commission an objective and empirical scientific study (vi) of how efficient windmills are at mitigating CO2 emissions.
We put these findings to the Minister of Energy and received a 3 page reply which was largely irrelevant or inaccurate. The letter incorrectly intimated that the Irish system was balanced by “old, relatively inefficient plant” – in fact the gas plants were relatively new.
The government did, however, agree:
“The Irish system is a better comparator to Britain as it is an island with wind being backed up predominantly by gas fired generation. Unfortunately we feel your otherwise very informative analysis falls into a trap of looking at a specific time period and trying to extrapolate from it. By looking at a period of time when pumped storage (which is a low carbon technology for balancing wind) was out of service you demonstrate a significant divergence between anticipated and actual emissions. It may be that the average intensity is significantly better than this, which is the danger inherent in taking short time periods in this way and using them to make a general point.”
Comment: This entirely misses our point. We looked at the time when the pumped storage was out of commission in order to see how the system performed when the wind was balanced by thermal plant, which is how the British system is balanced, and will increasingly be balanced if the government’s wind ambitions are achieved.
“Colorado and ERCOT: In both these examples, unabated coal plant is being used to back up wind.
This is a helpful case study of why it is important for the British government to pursue the development of carbon capture storage (CCS) if we want coal to play a long term role in our energy mix, and also a helpful example of why the design of the Electric Market Reform (EMR) needs to incentivise the building and operation of the right kinds of balancing generation. This is the subject of ongoing work, also of ongoing dialogue with relevant industry players.”
COMMENTS
- Let us believe CCS when we see it tested and viable.
- Our paper was focused on 2020 and the technologies that are on the table. The electric industry has been bedeviled by dreams of technologies of the future…
“We can agree with you on the need for objective and scientific study of the issues. The government is engaging with the range of relevant industry players who have the data to inform this discussion, and will use this to inform our market design decisions as we finalise the operational details of EMR.”
Comment: Our concept of an “objective and scientific study” does not envisage either the government or industry having a lead role because neither have a record of either rigour or objectivity.
The British government has no interest in evidence based policy, only in policy based evidence. It has no interest in the cost of decarbonisation, because it is attempting to save the planet?
Never mind that the Chinese, Indians and Indonesians are not joining in and are increasing coal burn for generation at a great rate. Even the Germans and Dutch have just completed ten large new supercritical coal plants. The British government (like some others) does not live on planet earth when it comes to “climate change” and the policies flowing there from.
1 This blog is based on an article titled “Wind – Whitehall’s pointless profligacy” that was published in New Power, Issue 45, October, 2012.
2 Director EEE Ltd; once a director of London Electricity; the first person to propose in 1987 a competitive restructuring of the electric industry in England & Wales; advisor on electric systems from Norway to New Zealand; author of “The British Electric Industry 1990-2010: the rise and demise of competition”.
3 Retired Dutch physicist who worked at CERN Geneva, latterly on the Large Hadron Collider.
4 A detailed simulation by Joseph Wheatley, Quantifying CO2 Savings from Wind Power, 2012 (for the version submitted before peer review) concluded the effectiveness was only 53% during normal operations.
END NOTES
i) The topic of the significant loss of thermal efficiency of gas and coal plants cycling is dealt with in detail by Willem Post in “Wind Power and CO2 Emissions”,
www.coalitionforenergysolutions.org/research_and_reports.
ii) Wind energy and CO2 emissions – 2, F. Udo, 21 October 2011, www.clepair.net/udo_okt-e.html.
iii) euanmearns.com/the-balancing-c…
iv) Wind turbines as a source of electricity. F. Udo, K de Groot and C. le Pair: www.clepair.net/windstroom e.html
v) How less became more: wind, power and unintended consequences in the Colorado Energy Market, Bentek Energy LLC, 16 April 2010, docs.wind-watch.org/BENTEK-How….
vi) While National Grid should be involved in the study, it should not lead it because it has a vested interest in claiming that windmills mitigate CO2 because it wants as many windmills on the system as possible in order to justify bulking up its grids. An example of the reaction of vested interests is given by the response of Mr. Nick Winser to Mr. Udo’s analysis of Ireland was “Thanks. Interesting. I doubt that your point about part loaded fossil negating the carbon benefits of wind is well founded particularly with our huge advances in wind forecasting accuracy.” There is a basic flaw in his response, namely although the forecasts may be more accurate that per se will not alter the outturn variability – hence cycling of plant.

